- 10. June 2007 ##################### mailing list update ##################
Fire Display Changed
I'm using an alternative data feed from the University of Maryland, after their FTP access was blocked. The biggest change, is now that the active fires displayed, are from the last 48 hours, and not 24 hours ago. The discrimination for fire temperature is no longer available. Only fires with a confidence of 90-100 are displayed.
Global Climate Display
From now on you'll notice an imprint on the maps in the upper left corner, showing the global
average temperature, and the climate change.
The climate change is expressed as
"Global Warming", when the average monthly temperature of the
randomly selected 122 weather stations worldwide is above normal,
or
"Global Chill", if the average temperatures are below average.
The weather stations used for this calculation of climate change are shown on this page: http://satellite.ehabich.info/index_10.html
Fire Display
Sadly no fire data are available at the moment, but this will be fixed soon.
- 6. June 2007
Fixing trouble with the screensavers
I just added a "Middle East 3D" view to the screensaver, website and desktops.
I noticed that afterwards my Windows 2000 (TM) systems suddenly had trouble changing the views in the screensavers. The problem was solved after emptying the Internet Explorer caches.
- 31. May 2007
Data complete for theClimate Change Display:
the historical data for all 122 weather stations tracked on my website have now been compiled. The historical data can be downloaded here . If you have better data please let me know.
In the as yet to be written explanation I will describe the rationale behind this project.
Correction to the historical Mecca data :
the data for Mecca was confused with data for Jiddah, which lies approx. 60km to the West on the coast, instead of Inland. That led to wrong stats.
- 2. May 2007 ##################### mailing list update ##################
DVD available
A DVD of animations of various maps over 9 months is in preparation. I chose to create movies from the archived images, because that is the most space saving and attractive method of storing and displaying the data (instead of 50 GB of images the movies contain the same information at one tenth the size).
Adjustment to the fire display sensitivity
It turns out that the forest fires in Central Europe are burning at a lower temperature than most tropical fires. Therefore the detection sensitivity had to be increased, to show fires from 310 Kelvin upwards.
I noticed that the old treshold from 340 Kelvin onwards was too low, when 10km² of German forest was reported to be burning in the news, but nothing was showing on the firemaps.
- 25. April 2007
Extreme High April Temperatures in London
I have been observing for a number of days now the above normal temperatures in London, which are over 7 degrees Celsius for the month of April.
This is a temperature record for Europe, and I have checked a few times if there are errors in my formula and calculations.
But this is not so.
Nevertheless, I have changed the weather station so that it is easier to compare the temperatures from London City Airport to London Gatwick Airport.
Gatwick Airport historical temperature data span over a period of over thirty years, from 1961 to 1991.
As a reminder, the figures which display the average temperature deviation show the difference between historical temperatures average (sometimes climate records of over 200 years!) with the moving current monthly average, which is calculated as the month progresses!
This first months running average is possibly a bit higher than average, because I am recording the temperatures from the 7th of April, instead of the 1st of April.
- 15. April 2007
Global Climate Change Display
The first 4 stations of the global climate change display are entered. The present display is provisional and will be supplemented by a more graphical map. The first cities are: Koln, Warsaw, St.Petersburg and Bucharest. The format of the display is as follows: Koln 23C | +5,
where after the "|" the mean temperature deviation is shown in +/- degree Celsius.
There are approx. 121 weather stations being tracked by this website.
Since the beginning of this month I am recording the daily temperatures,
to arrive at a monthly average temperature for each station.
My current data is now being compared with historical temperature data, and the difference is calculated and shown. The historical data can be downloaded here . If you have better data please let me know.
- 9. April 2007
Changed behaviour of spoken quake alerts
The spoken quake alerts are now classified into "heavy" and "all" quakes.
The heavy quakes which are announced are from both the USGS and EMSC sensor network. The quakes are stronger than 6 on the Richter scale and not older than 2 hours. When there are no heavy quakes then the alert remains silent.
All quakes are from both USGS and EMSC networks. Every quake above Richter 2.5 is announced. When there are no quakes in the last 2 hours it is announced that no quakes were reported.
-
8. April 2007
Global Warming
I'm working on a "live" display of average temperatures for the cities, comparing the temperatures with historical average temperatures. Like this YOU can see whether or not temperatures are really increasing and decide if Global Warming is real.
Astronomical views
The navigation on the webpages has been improved.
The Earth from the Moon
A five second movie clip has been added, which is updated 2 x daily.
-
6. April 2007
Progress of lunar eclipses
It is possible to watch the progress of lunar eclipses on this website, by visiting any of the pages where the moon is visible. The progress of the lunar eclipse on the 4th March 2007 is captured in a small movie  download here. (To see all details enlarge to full-screen). download here. (To see all details enlarge to full-screen).
-
5. April 2007
Screensavers updated to be Windows Vista compatible
Even though I have not received complaints the screensaver software
has been updated to be compatible with Windows Vista. You can simply upgrade your present free software installation by downloading the latest version and installing over the old program. (Windows is a registered trademark of Microsoft Corporation in the United States and other countries.)
American Screensavers now display temperature in Fahrenheit
The start screen of the American screensavers is now Fahrenheit, as standard. The scale can still be changed to centigrade, manually.
-
21. March 2007
Inclusion of Fire display in the main Earth map
Because the display of fire activity is very accurate it is now included in the general Earth overview. Fires are just as devastating a natural disaster as storms or earthquakes. With the potential to contribute massively to global warming and have adverse effects on all creatures.
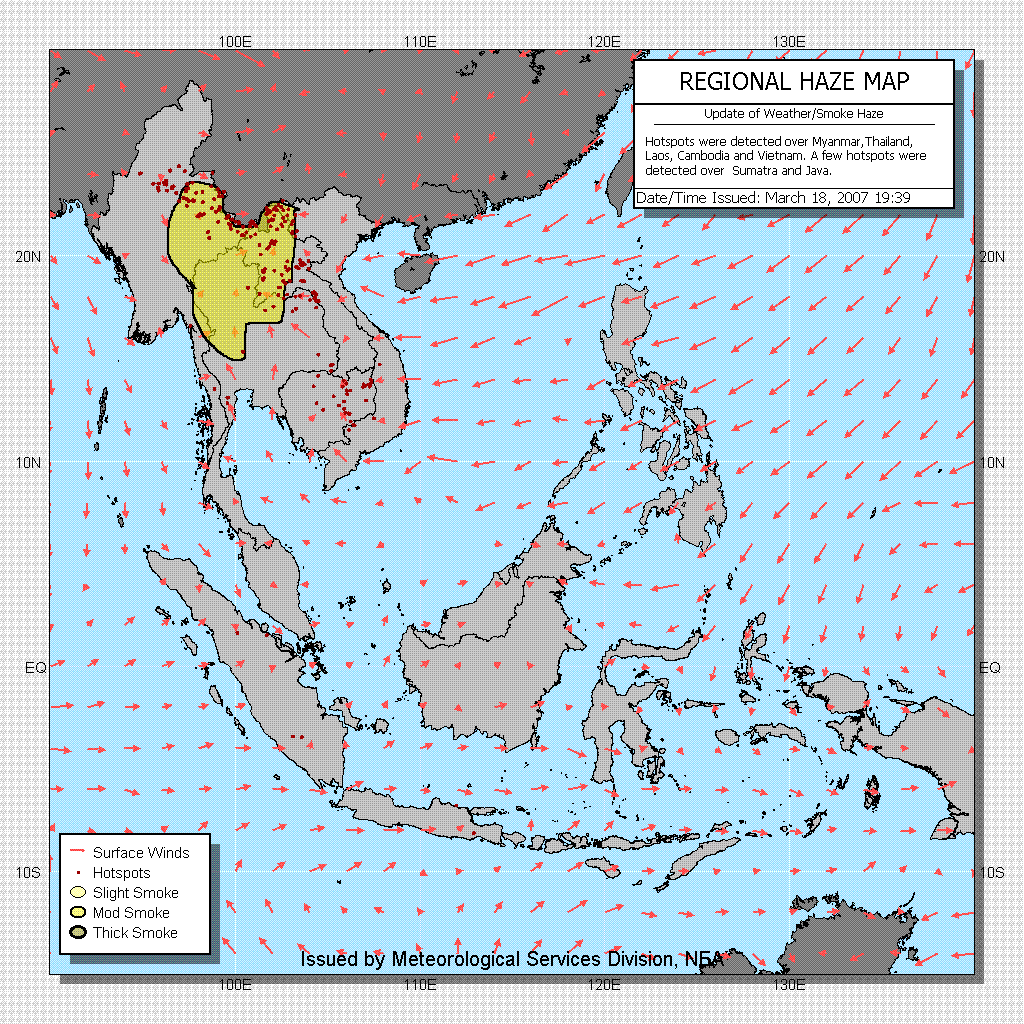
18. March 2007
The North of Thailand chokes on smoke from fires :
 (see Word Fire Map) (see Word Fire Map)
Flights cancelled because of poor visibility; four provinces covered by smoke for more than a week
The haze was so bad that pilots could not land and flights had to be diverted.
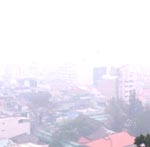 The smoke haze choking northern Thailand is caused by dry season stubble burning, forest fires and wood-fired cooking. The smoke haze choking northern Thailand is caused by dry season stubble burning, forest fires and wood-fired cooking.
Snaphot Haze Map 18.March
Thai Haze Online
- Sunday, 14.
January, 2007
Australian bushfires' colossal effect:
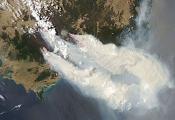 Australian monster bushfires have generated the power of more than 100 atomic bombs and pumped out millions of tonnes of pollution, greenhouse gas and toxic clouds. CSIRO atmospheric scientist Mick Meyer said the fires generated 2.5 million tonnes of carbon monoxide; 300,000 tonnes of volatile organic compounds such as benzene, formaldehyde and hydrocarbons; 85,000 tonnes of methane; 64,000 tonnes of nitrogen oxides; and 59,000 tonnes of smoke. Australian monster bushfires have generated the power of more than 100 atomic bombs and pumped out millions of tonnes of pollution, greenhouse gas and toxic clouds. CSIRO atmospheric scientist Mick Meyer said the fires generated 2.5 million tonnes of carbon monoxide; 300,000 tonnes of volatile organic compounds such as benzene, formaldehyde and hydrocarbons; 85,000 tonnes of methane; 64,000 tonnes of nitrogen oxides; and 59,000 tonnes of smoke.
above: NASA image
Methane and nitrogen oxide emissions would add to global 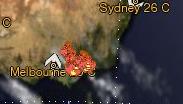 warming with the heat-absorbing gases creating an effect equal to 2.6 million tonnes of carbon dioxide. The energy produced by the blazes also dwarfs that produced by humans, according to data provided by the CSIRO and energy agencies. warming with the heat-absorbing gases creating an effect equal to 2.6 million tonnes of carbon dioxide. The energy produced by the blazes also dwarfs that produced by humans, according to data provided by the CSIRO and energy agencies.
Link: Herald Sun
above: CGI image from opefs.com data
- Tuesday, 9.
January, 2007
Debugging of faulty error handling in EMSC data
Cause: when the European Mediterranean Seismological Center did not show a quake strength next to a location a wrong value was shown.
The example on which I noticed this was an earthquake near Basel (home to a number of small quakes recently caused by geo-thermal drilling!).
The strength of 5.2 was way too high to be feasible!
My script erronously displayed the strength of a quake from Myanmar, further down the list.
- Sunday, 7.
January, 2007 ############ mailing list update ###############
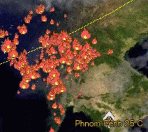
Global Fire Index
To be able to better keep an eye on the fire detection rate of the MODIS satellite a running total of all fires found in the past 24 hours is now displayed.
- Sunday, 7.
January, 2007
Record number of global fires
As a result of the large number of fires, most of which appear to be located in the equatorial belt in Africa, I needed to reduce the sensitivity of the fire display. My computer was no longer able to compute the necessary calculations for the maps in the time slots available.
I've only been monitoring the global fires
for about 6 months, therefore I can't tell if the number of fires is higher than usual for this time of year, or about normal.
Now only the brightest fires above 340 Kelvin temperature are shown, whereas before all fires above 300 Kelvin were on the map display.
- Thursday, 21.
December, 2006
 EMSC quake warnings online again EMSC quake warnings online again
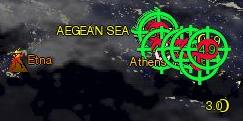
I have adapted my code to read the European Seismological Center data from their new RSS feed, just in time to witness unusual widespread large-scale earthquakes around the Aegean Sea region around Athens.
Primary Cloud Source online again
The disruption was only a few minutes long, all told.
- Wednesday, 20.
December, 2006
Primary Cloud Source offline
Appears that the cloud server has problems.
Switching over to secondary data source (low resolution).
- Friday, 15.
December, 2006
EMSC quake warnings not working
The European Mediterranean Seismological Center has changed the formatting of its webpage. As a result the quake warnings are temporarily offline from this source.
- Thursday, 16.
November, 2006
The Global Volcanism Program of USGS and the Smithsonian Institution
have updated their Volcanism markers to include Mount Etna as an active volcano.
- Thursday, 9.
November, 2006 ############ mailing list update ###############
Marker for Mount Etna added
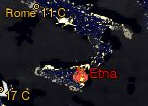 I've now waited almost two weeks to see if the Global Volcanism Program of USGS and the Smithsonian would add Mount Etna in Sicily to the list of their active volcanoes. The Global Volcanism Program is the source for my Active Volcano makers. I've now waited almost two weeks to see if the Global Volcanism Program of USGS and the Smithsonian would add Mount Etna in Sicily to the list of their active volcanoes. The Global Volcanism Program is the source for my Active Volcano makers.
That Etna is an active volcano is quite appparent from the visible Lava outflow detected by the Rapid Response System of MODIS, University of Maryland and Goddard Space Flight Centre. The news also collaborate my observation (9. Nov.:Italian News via Google).
- Wednesday, 18.
October, 2006
Possible lunar causal influence on Hawaiian earthquake and
Kilauea eruption on 15.Oct 2006 by Erich Habich, opefs.com
During the Hawaiian earthquake magnitude 6.7 on Sunday, 15.Oct. 2006, the Moon was seen passing over the area of Hawaii. The earthquake was the strongest in two decades. On these maps and movies the moon image represents the "sublunar point", which is the area where the Moon exerts the greatest gravitational force on Earth: (see http://tidesandcurrents.noaa.gov/restles3.html)
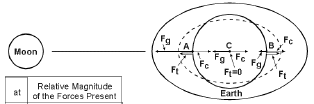
The following sequence of images illustrates the possible effect of the Moons gravity on seismic activity in Hawaii on 15.Oct. 2006:
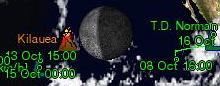
16:48 UTC
|
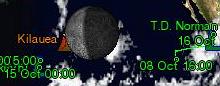
17:08 UTC
|
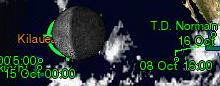
17:27 UTC
|
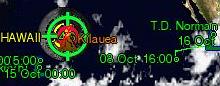
17:47 UTC |
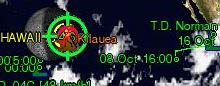
18:07 UTC |
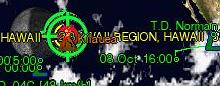
18:27 UTC |
The times are accurate to within 10 minutes.
Download
movie of the Hawaiian earthquake and lunar pass
My take on this is that chaos theory tells us that tiny causes can have huge effects, such as butterflies flapping wings in the Himalayas can cause a hurricane on the other side of the world. Why shouldn't the moon then cause a quake on Earth, especially when it stands precisely over the spot where a magma chamber is weakened to the point of bursting anyways?
The strictly scientific view that earthquakes should then always happen more often in places over which the moon passes would be a simple mechanistic one, without taking into account chaos theory.
References:
Pro & contra lunar influences: National Geographic
Pro lunar influences: Pulse of the Planet Audio Presentation (NatGeo)
Contra lunar influence: Centre for Astrophysics and Supercomputing, Australia
-
Tuesday,
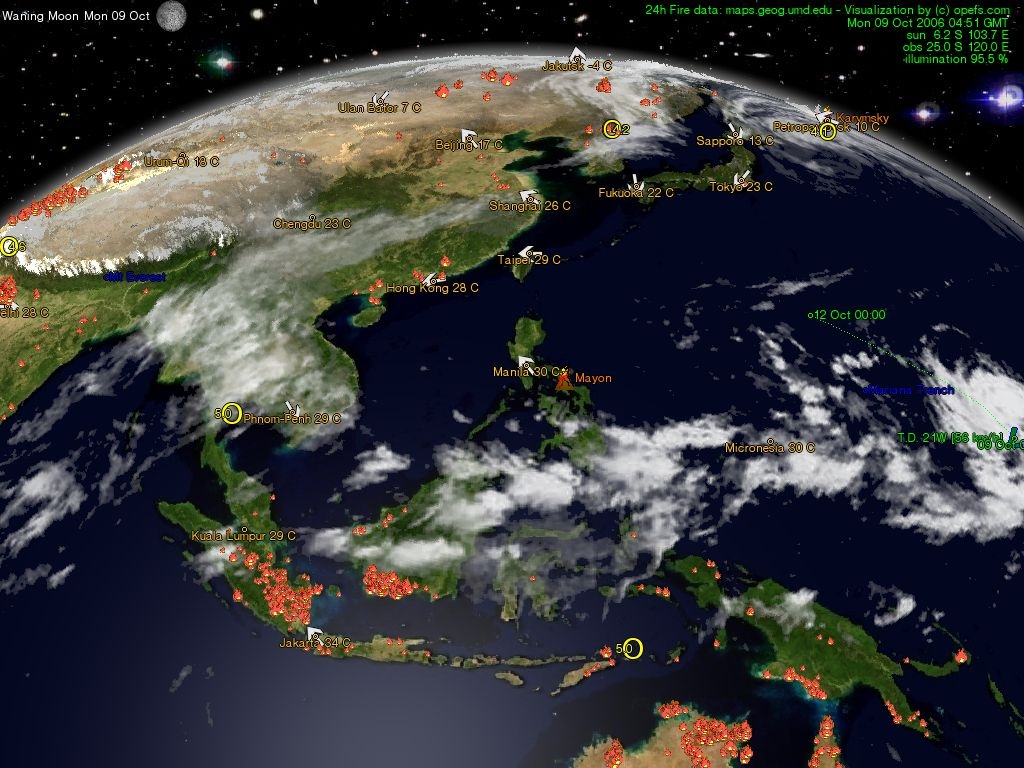
10. October, 2006
 North-Korean
Nuclear test North-Korean
Nuclear test
Visitors to this website were among the first to notice North-Koreas
nuclear bomb test. The Earth tremors of Richter 4.2 in Hamgyong
province were later confirmed to be the result of an underground
atomic bomb.
Download
movie of the nuclear bomb test (watch for the yellow
circles titled 4.2 at 4:51 GMT in North Korea).
- Wednesday, 27.
September, 2006 #########
mailing list update #############
Increase
in the screen resolution of the "natural earth map" and
"global fire map"
To take account of the steadily increasing screen resolution caused
mainly by the use of LCD displays I've increased the resolution of
the quoted maps. Unfortunately maps with text do not scale down very
well, (from 1280x1024 to 1024x768), and low resolution maps scale
up relatively coarsely.
Monitor
Resolution Share:
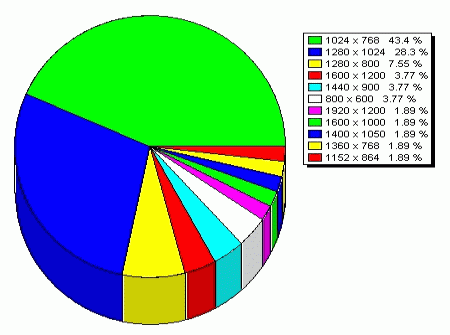
Hopefully
users with high definition monitors will watch their screensavers
mainly from a distance, so that they don't see the pixels, because
if I increased the resolution of all the maps then half of the other
users would not be able to decipher the text markers.
- Sunday, 10. September,
2006
Debugged
the movie display of the freeware screensavers
Only in the freeware screensavers it was not possible to exit the
hurricane movies without exiting the whole screensaver: fixed by including
a back button.
Fully
debugged the earthquake warning system
A few bugs were present in the beginning, but that has been fixed.
- Monday, 4. September,
2006
Increase
in the resolution of the European Crescent Map
The resolution of the european sector close-up has been trebled, both
day- and night maps.
Silent
Earthquake alerting
The spoken earthquake announcements have now been turned into "alerts".
Messages are only spoken at or above a strength of 6 on the Richter
scale, else no sound is heard!
I have not been able to fully debug this feature yet, because presently
there are no quakes at or above strength 6, but hopefully everything
should work.
- Wednesday, 9.
August, 2006
Closing
the hole in cloud cover over the poles
This is a cosmetic "improvement". Because the angle of the
north- and south pole from the geostationary weather satellites is
too steep, the poles are usually shown without cloud cover.
To improve the visual appearance I am mirroring a small cloud strip
to close the polar cloud cover.
Increase
in the resolution of the moon map
I
found a moon map produced by the Clementine spacecraft of the Naval
Research Laboratory which shows more detail.
Starting
the German soccer season
Just
in time for the start of the German soccer season the sport page has
been re-activated: http://satellite.ehabich.info/index_11.html. The
seasons plan not yet completed, but the results of the current week
are online.
- Sunday, 23. July,
2006
World
Fire Coverage
As far as it is possible, the fire data are now displayed on all continents.
The only thing still missing is the global fire map. I'm surprised
at the number of fires in Eastern Europe. Maybe I will eventually
do some fine tuning on the display, but I need to see how it develops
first.
Animations
for Australia, Africa, South America and Asia
They are all ready to go and fully set up, but I don't have anymore
time today to weave them into the website content.
- Saturday, 22.
July, 2006
Changes
to Global Incidents
The most controversial item ever on this website was the display of
global incidents maps on all maps. Not only did I in response remove
those incidents from the detail maps, but also I track only the results
of natural catastropies. The incidents are seen now only on the global
incidents map, the Middle East pages and on the hurricane close-up
pictures.
In the past I have regularly deleted older happpenings, because the
small world map simply got too crowded with events.
This will change. From now on only the incidents of the current month
are displayed on the Global Map. In preparation for a more detailed
2nd level display, equivalent to the current continental maps, the
old data are no longer deleted. The historical (and valuable, in terms
of a reminder of past catastrophies) global incident data will be
displayed there.
The detailed display of global incidents will only be drawn maybe
once per day, after all, I don't update the list more often. I hope
this will be ageeable by all.
- Friday, 21. July,
2006
A
prototype world fire map is here: [click]
These are the fires from yesterday. There are wildfires, bush fires,
and slash and burn practice.I am shocked that this display actually
works.
World Weather Movie :
The "animations page" has been updated. Instead of showing
a javascript animation with 4 frames animated over a period of 24
hours, I've added a 144 frame movie which shows in fullscreen resolution
the last 48 hours: http://satellite.ehabich.info/animations.html . It doesn't just show the weather, If you search for patterns in
quake activities for example, then this movie may be of interest for
you, too.
- Thursday, 20.
July, 2006
Upcoming
additions: ######### mailing list update #############
Fire
tracking:
I've been given
permission to access satellite data which track global fires. This
is at present of special interest to many Americans because of raging
wildfires. I will try to add this data a.s.a.p.
Ship tracking:
within the next
few days a new ship tracking function will be added. Being tracked
are famous cruise ships, sailing ships (some take paid crews) and
oceanographic research vessels. In addition to showing a boat marker
with the name I will try to add a reading for the water temperature.
This is of special interest in the arctic and antarctic regions.w
Addidtions
which are ready:
New menuing
system for wallpapers (active desktops):
Even though Internet
Explorer 7 will not support Active Desktops in their current form
anymore, I intend to carry on producing the desktops, using a different
method. Even though I don't know which method as yet I have updated
the existing installations to a new javascript dropdown menu style.
Movies on the desktop:
If you have explored
the new features of the 2 dropdown menus you may already have found
the movie animations. Provided that you have DivX installed, these
movies play as fullscreen wallpapers in the background.
More features, faster
The reason for installing the new menus is that I can add new content
now within minutes, by just change one file in the menu, instead of
changing 80 files+ as previously.
Teething problems
I noticed when I woke up that my new desktop background still was
showing the picture from the day before. A quick "reload"
by right clicking on the desktop confirmed my suspicion: the active
desktop had not automatically updated.
Seeking the error
I quickly realized that the new menu configuration had disabled the
auto-refresh feature.
Scrambling fast I found a new solution which I first tried on three
browsers (IE, Firefox, Opera), which was then uploaded.
Consequences
It wasn't just the desktops which no longer auto-refreshed since the
installation of the new dropdown menu: also the free and pay screensavers
were affected.
All screensavers have now also been issued with the new auto-refresh
update fix (Microsoft would call it a patch).
Improved hurricane tracking :
Images from the
hurricane tracking pages are now imprinted with tracking information.
Global temperature
movie:
This movie has
already been on the "webcam" portion of the site for a few
weeks. I find the 48 hour movie very informative because it gives
a quick overview of the temperature development, with the hottest
and coldest places quickly discovered.
- Monday, 17. July,
2006
Hurricane Movies:
Experimentally
added are hurricane movies. A movie is created from a hurricane only
after it has been named. When a hurricane is still "fresh",
or only just appeared, then in the extreme the movie may be just a
few milliseconds long because it is still missing frames to animate.
Changes to the
full screen movie pages:
A few of you may
have been missing controls to return to the previous page, in the
full screen screensaver option. This has now been added.
- Thursday, 13.
July, 2006
Genesis-1 launched
and deployed:
The Genesis-1 habitation
module of Bigelow
Aerospace is deployed. A private effort of Las Vegas
real estate magnate Robert T. Bigelow, this experimental inflatable
spacecraft rocketed into orbit yesterday to test technology that could
be used to fulfil the dream of building a commercial space station.
Robert T. Bigelow owns the Budget Suites of America hotel chain.
To be able to follow
the progress of what may be the seed of the first space hotel chain,
I have included a marker showing the progress of the Genesis module
on all maps. The status page for the Genesis Project / Bigelow Aerospace
is here.
older postings
|


 This
work is licensed under a
Creative
Commons Attribution-NonCommercial-ShareAlike 2.0 Germany License.
This
work is licensed under a
Creative
Commons Attribution-NonCommercial-ShareAlike 2.0 Germany License.